
Feedback from participants involved in the voting has resulted in some changes to the interface for the Symbol Manager. There has been the introduction of a quick voting screen that removes the clutter causing problems and allows the user to see a large image of the symbol alongside the presentation of the criteria.
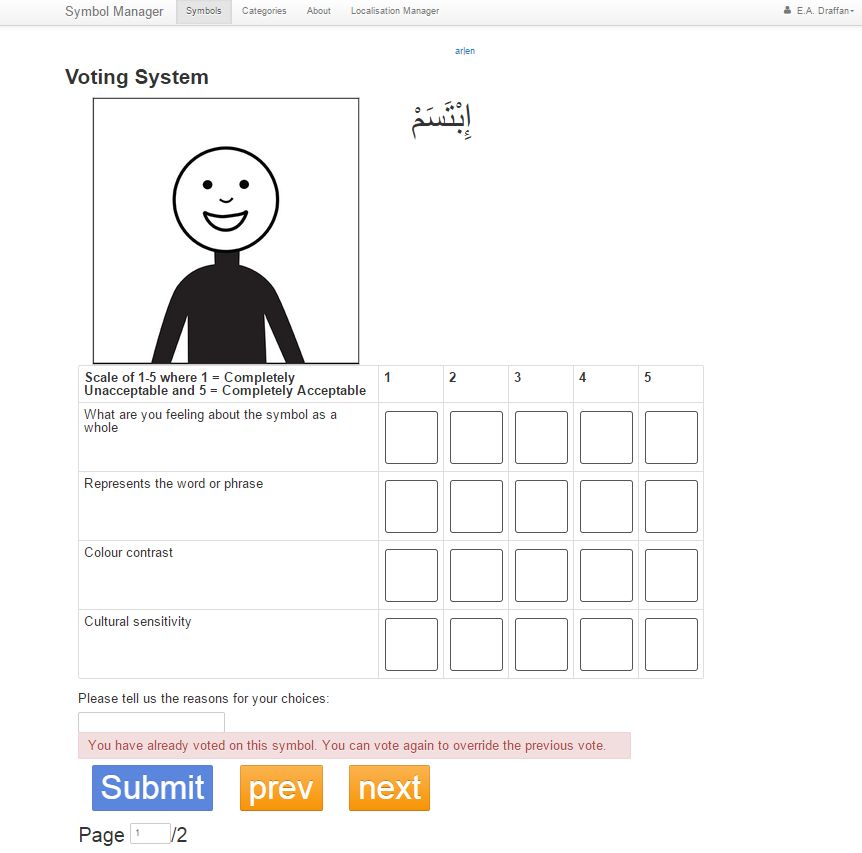
There was also a discussion about the criteria as some felt it would be better to have the image showing without the symbol label but later several therapists asked for the label to be available in English, MSA and Qatari not just MSA. However, there may be slight differences in the translation and this will need to be discussed.
It was decided to stay with the closed-ended questions used to measure iconicity of each symbol and to keep the five point scale rather than the seven point scale mentioned by Evans et al (2006). The optimal length of the Likert scale is a complex subject and can affect the end result (Friedman and Amoo, 1999a).
In trying to keep the criteria scales as simple as possible it appears that one can re-scale results when comparing a seven point scale to a five point scale (Dawes, 2008) and it is even possible to have more clear cut decisions if a shorter scale is used (Foddy, 1993). There was also the debate about having a mid-point where there is thought to be a tendency to choose 3 in the case of a 5 point Likert scale. However Lietz (2008) points out that the research shows
“response without the middle. point had lower validity and higher random error
variance, indicating that people randomly chose other available response
options when the middle option was not available. This desirability of having
a neutral middle point to increase the reliability and validity of response
scales has also been confirmed by a meta-analysis of 87 experiments of
question design reported by Saris and Gallhofer (2007).”
The next set of voting results will come via the Quick Vote system which was piloted by Tullah with 20 therapists and teachers initially using paper based versions of the system to discuss the best way forward as well as issues around the style of the symbols. This will be discussed in the next report as Nawar has now made it possible for Symbol Manager to export voting data directly to Excel using Power Pivot.
References
Evans D, Bowick L, Johnson M, Blenkhorn P (2006) Using iconicity to evaluate symbol use. In: Proceedings of the 10th international conference on computers helping people. Linz, Austria, pp 874–881
Foddy, W. (1993). Constructing questions for interviews and questionnaires: Theory and practice. Melbourne: Cambridge University
Friedman, Hershey H. and Taiwo Amoo (1999a). “Rating the Rating Scales.” Journal of Marketing Management, 9 (Winter), 114-123.
Lietz, P. (2010). Research into questionnaire design – a summary of the literature. International Journal of Market Research, 52(2), 249-272.